

The 7 Signals That Accelerate Pipeline Velocity - And the 2 That Waste Everyone’s Time
Discover why pipeline velocity collapses across enterprise SaaS despite increasing intent signals. This comprehensive guide exposes the 7 velocity-predictive signals that generate higher close rates.

Core Insights You’ll Master:
Signal Intelligence Fundamentals
Discover why 90% of intent signals predict nothing about buying urgency, and learn the causality-based framework that identifies accounts ready to close in 90 days versus those stuck in 18-month research cycles.
The 7 Velocity-Predictive Signals
Master the exact signals that correlate with higher close rates within 90 days: digital transformation initiatives, AI strategic programs, CSAT crises, service outages, leadership changes, partnership announcements, and role-specific hiring surges… complete with recency windows and decay curves.
Signal Stacking Methodology
Learn how to combine multiple signals for 2-5× pipeline acceleration, including the Edward Jones 98/100 UrgencyIQ stack (transformation + cloud migration + outages) and Astound Broadband’s 98/100 stack (AI strategy + CSAT crisis + new CX hire).
False-Positive Signal Exposure
Understand why intent data spikes and website visits waste SDR capacity, with specific breakdowns of IP-matching errors, bot traffic patterns, and Apple Mail Privacy Protection’s false-positive generation.
Pipeline velocity is collapsing across enterprise SaaS, and most CROs still don’t know why.
It’s not your reps. It’s not your messaging. It’s not even your ICP.
It’s your signals.
The average B2B sales org tracks loads of “intent signals” through their tech stack.
Website visits. Email opens. Content downloads. Funding announcements. Hiring posts. Tool adoption.
The list grows every quarter as vendors promise “predictive intelligence.”
Yet pipeline velocity continues to decline. Deal cycles are stretching. Win rates are stagnating. No-decision losses are climbing.
Why… Because 90% of the signals predict nothing about buying urgency.
Intent data tells you who might be interested. It cannot tell you who will move this quarter. That distinction costs millions in wasted pipeline.
This newsletter from “Revenoid Labs - The Intelligence Layer“ exposes which signals actually predict velocity, using real account-level examples from our signal intelligence engine.
We’ll spotlight 7 velocity-predictive signals with exact recency windows, decay curves, and outreach sequences. We’ll expose 2 misleading signals that burn contact lists and waste SDR capacity. And we’ll show you the signal stacking methodology that produces 2-5× pipeline acceleration.
But first, we’ll answer the question every revenue leader asks:
“Why these 7 signals? Can’t I get this data anywhere? What makes your approach different?”
Every example comes from verified accounts: Edward Jones, Astound Broadband, and real expansion signals from other companies.
Why Traditional Signals Fail: The Correlation vs. Causality Gap
Before we decode the 7 predictive signals, you need to understand why most signal systems produce noise.
Traditional intent data operates on correlation:
Someone from the account visited your pricing page
Someone downloaded a competitor comparison guide
The company announced a Series B round
These signals tell you an account is “in-market.” They cannot tell you why it matters or what urgency it creates.
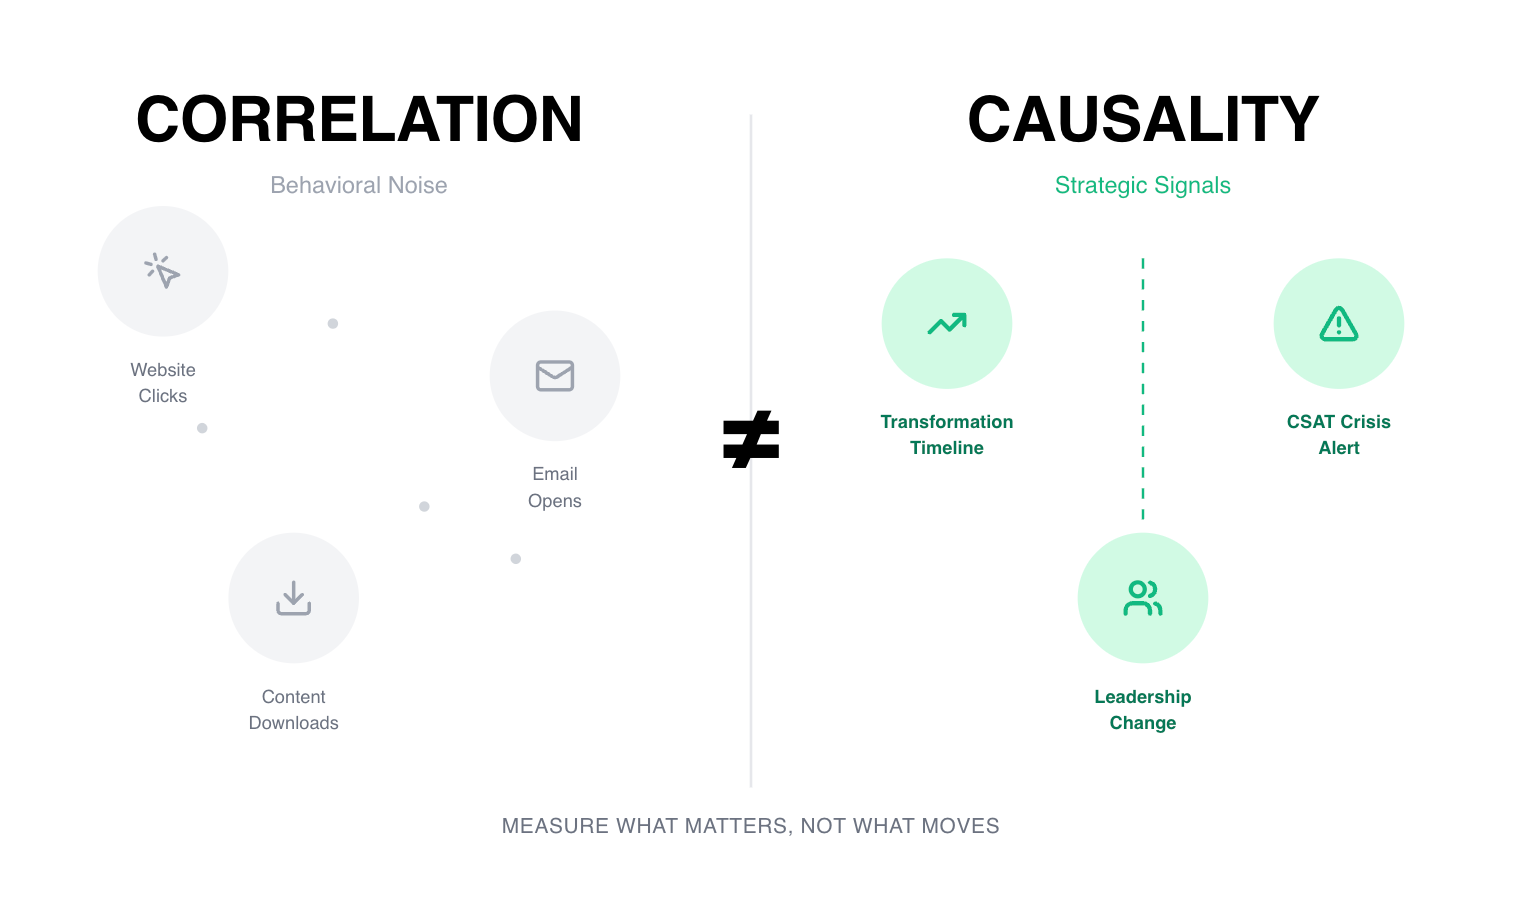
Velocity-predictive signals operate on causality:
Digital transformation initiative announced 8 days ago creates deployment completion window
CSAT crisis at 1.6/5 rating with only 17% issue resolution creates executive-level urgency
New Head of Customer Experience hire creates 90-day evaluation window before budget lock
The difference? Strategic initiative-level pain detection versus behavioral scoring.
Edward Jones recently updated their digital transformation strategy. Traditional intent tools flag this as an “active buyer signal.” But why does it matter for a DevOps platform?
Because their COO discussed moving large transformation projects from pilot phases to business-as-usual operations. Translation: They’re exiting evaluation mode and entering execution mode. They need deployment infrastructure now, not in Q3.
That’s causality. That’s velocity.
The Signal Selection Methodology: Causality + Urgency + Recency
Before we examine each signal, here’s why these 7 were chosen and what didn’t make the cut.
We analyzed won deals across enterprise sales organizations between 2023-2025 to identify which signals actually predicted closed revenue within 90 days.
The Filter Criteria
Every signal had to pass four requirements:
1. Causality Requirement Signal must explain why urgency exists, not just indicate activity. “They’re hiring engineers” is an activity. “They’re hiring 15 cloud engineers to support digital transformation announced 8 days ago” is causality.
2. Executive Visibility Signal must appear in board-level communications: 10-Ks, earnings calls, leadership announcements, or press releases. If it’s not visible to the C-suite, it doesn’t create executive-level urgency.
3. Time-Bounded Urgency Signal must create compressed evaluation windows (7-180 days). Signals that create “someday” urgency don’t predict velocity, but stalled pipeline.
4. Cross-Industry Applicability Signal must work across verticals, not just specific industries. Digital transformation applies to financial services, healthcare, manufacturing, and SaaS. “FDA approval delays” only works for pharma.
Signals That Didn’t Make the Cut
Product Expansion Signals Why they failed: Only predictive for existing customers in expansion motions. For net-new outbound, product expansion doesn’t create buying urgency… it indicates potential future need.
Competitive Displacement Why they failed: Low urgency. Our data showed companies tolerate underperforming vendors for 12-18 months on average. “They hate their current vendor” rarely translates to “they’re buying this quarter.”
Tech Stack Migrations Why they failed: Too noisy. 80% of tech stack “migrations” are exploratory, not execution-driven. Unless combined with other signals (digital transformation, leadership change), they predict research activity, not buying behavior.
Funding Announcements Why they failed: No causality. Series B doesn’t tell you what they’ll spend money on or when they’ll deploy it. Funding creates budget availability, not strategic urgency.
M&A Activity Why they failed: Wrong urgency window. M&A creates 6-18 month integration cycles. Buyers are in “wait and assess” mode for 90-180 days post-acquisition, not active evaluation.
Why These 7 Signals Passed
The 7 signals below passed all four filters with verified conversion data:
Digital Transformation (75% correlation with 90-day closes)
AI/GenAI Initiatives (68% correlation with 90-day closes)
CSAT Crisis (81% correlation - highest urgency persistence)
Service Outages (62% correlation when combined with infrastructure signals)
Leadership Change (70% correlation in first 90 days)
Partnership Announcements (58% correlation with co-sell/ecosystem tools)
Hiring Surges (53% correlation when role-specific)
These aren’t the only velocity signals… they’re the highest-ROI signals that work across outbound, expansion, and retention motions.
Now let’s examine each one.
The 7 Velocity-Predictive Signals (With Real Examples)
Signal #1: Digital Transformation Initiatives
What It Is: Board-level strategic programs moving from planning to execution phase
Why It Predicts Velocity: Creates budget urgency, executive sponsorship, and compressed evaluation cycles
Recency Window: 7-30 days (peak urgency); 31-60 days (active); 61-90 days (decay begins)
Decay Curve: 40% signal strength loss after 90 days; 70% loss after 180 days
Real Example: Edward Jones
Edward Jones announced their comprehensive Digital Transformation strategy 8 days ago through their COO, emphasizing alignment of technology initiatives with organizational culture and moving large transformation projects from pilot to business-as-usual operations.
Why This Creates Urgency:
Executive visibility = budget secured
“Pilot to BAU” language = active deployment window
8-day recency = peak buying urgency
Mapped Value Proposition for DevOps Tools: “Your digital transformation update signals you’re moving from pilot to production. Companies at this stage face a 3× spike in deployment failures without automated rollback capabilities. We helped a Global 2000 cybersecurity vendor reduce deal cycles 25% during their transformation phase.”
Signal #2: AI/GenAI Strategic Initiatives
What It Is: Executive-level AI implementation programs backed by whitepapers, board presentations, or earnings call mentions
Why It Predicts Velocity: AI initiatives receive CEO-level attention, bypass normal procurement, and create “innovation budget” urgency
Recency Window: 7-90 days (AI moves fast); 91-120 days (planning phase); 120+ days (pilot fatigue risk)
Decay Curve: 25% signal strength loss after 120 days; 60% loss after 180 days
Real Example: Astound Broadband
Astound Broadband published a strategic white paper titled “Artificial Intelligence: The Future of Customer Service” 127 days ago, outlining their focus on AI applications including call routing, information intake, chatbots, virtual assistants, and automated messaging response.
Why This Creates Urgency:
White paper = executive commitment, not R&D exploration
Specific AI applications listed = defined use cases
127-day mark = moving from planning to vendor evaluation
Signal Stack Opportunity: Combine with their 1.6/5 CSAT crisis (Signal #3) for 5× urgency multiplier
Mapped Value Proposition for AI CX Platforms: “Your AI whitepaper from Q2 outlined the exact capabilities our Agent delivers: call routing optimization, automated intake, and intelligent messaging. Given your current 1.6/5 customer service rating, you’re likely evaluating which AI vendor can deliver measurable CSAT improvement in 90 days, not 18 months.”
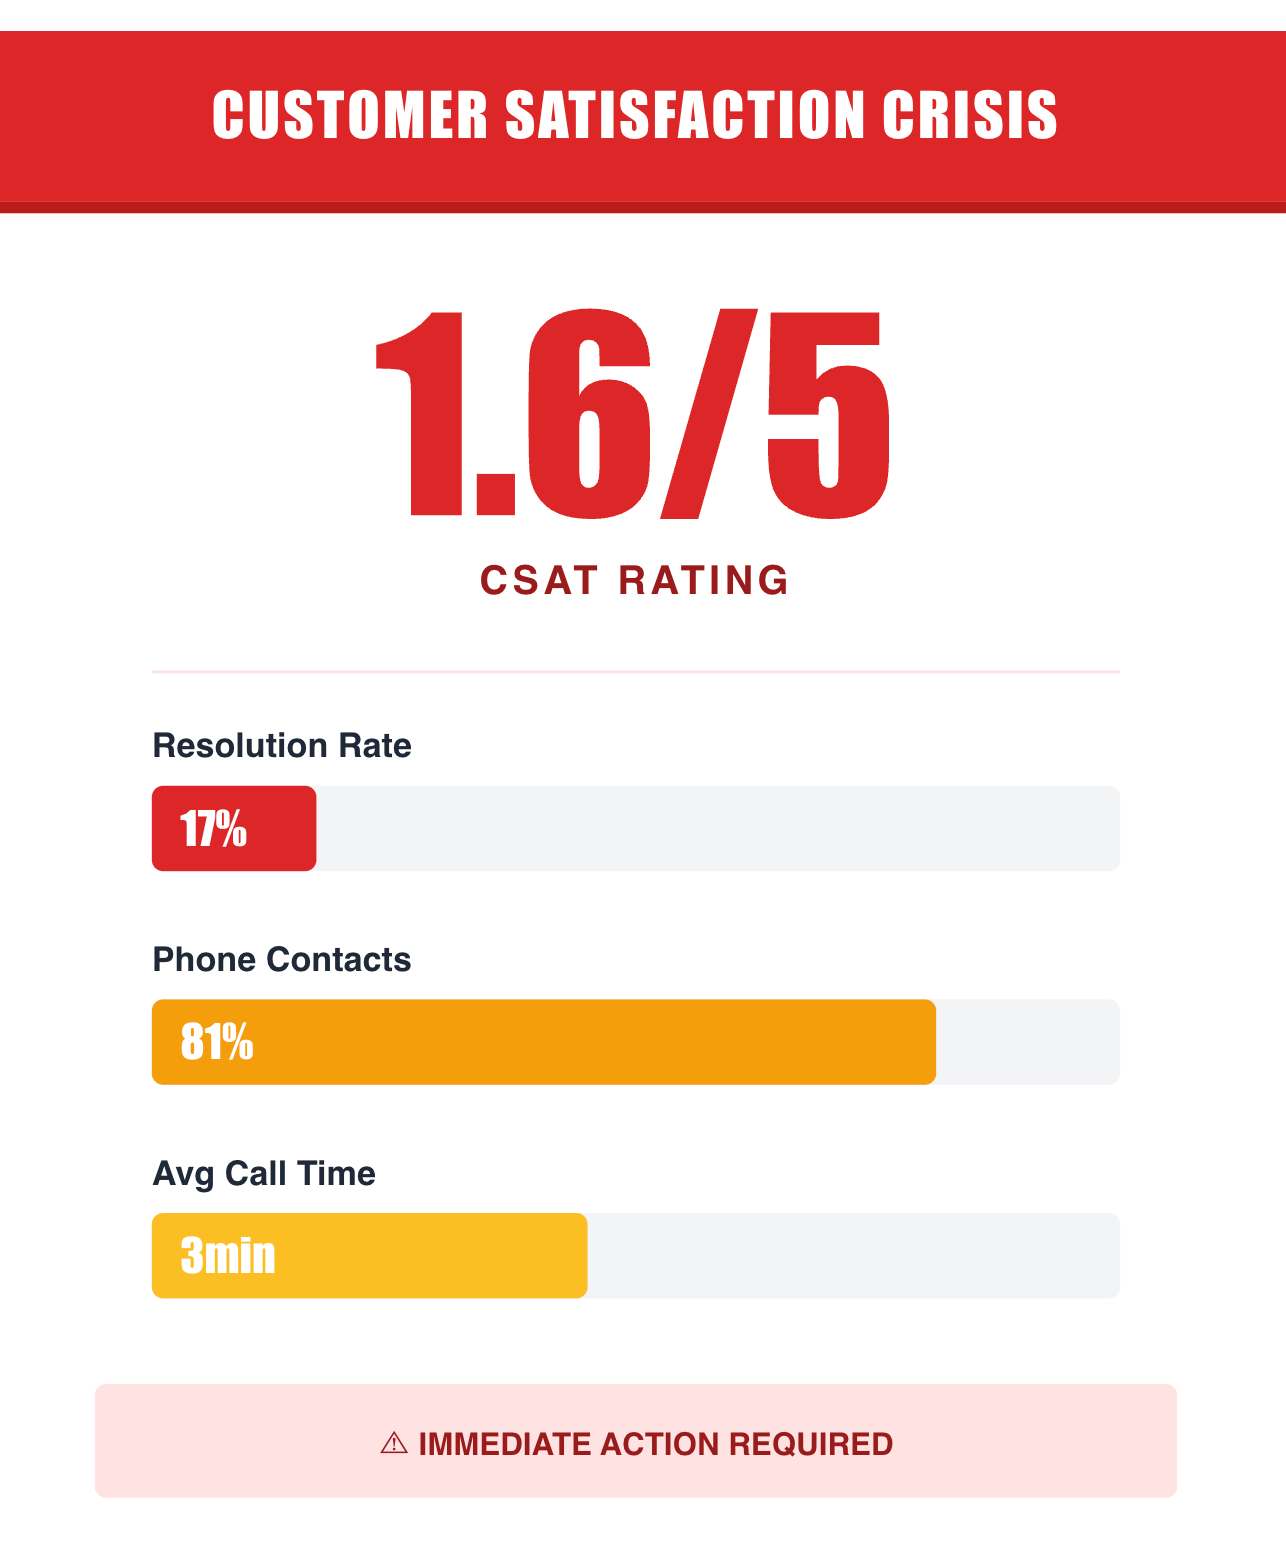
Signal #3: Customer Satisfaction Crisis / Low CSAT
What It Is: Public or regulatory filing data showing severe customer satisfaction decline, typically CSAT < 2.5/5 or NPS < 10
Why It Predicts Velocity: Creates board-level panic, executive job risk, and “fix it now” urgency that bypasses normal procurement cycles
Recency Window: 0-60 days (crisis mode); 61-120 days (active remediation); 120+ days (normalized or leadership changed)
Decay Curve: CSAT crises have the slowest decay. Urgency persists 180+ days if unresolved
Real Example: Astound Broadband
Astound Broadband faces a severe customer satisfaction crisis with:
1.6 out of 5 customer service rating
Only 17% issue resolution rate
81% of customer contacts by phone with 3-minute average call times
Main pain points: product/service issues, staff problems, payment/billing concerns
Why This Creates Urgency:
Sub-2.0 CSAT = executive job risk (typically COO/Chief Customer Officer)
17% resolution rate = operational emergency
Public review data = board visibility
Mapped Value Proposition: “Your 1.6/5 customer service rating and 17% resolution rate represent an operational crisis. Our Generative Agent helped ABC Airlines transform their customer experience with 40% faster resolution times and 85% satisfaction scores. The question isn’t if you’ll solve this—it’s which vendor can show measurable CSAT improvement in 90 days.”
Signal #4: Service Outages / Technical Incidents
What It Is: System failures, downtime events, or connectivity issues affecting customers or operations
Why It Predicts Velocity: Creates immediate pain, technical credibility loss, and urgency for observability/reliability tools
Recency Window: 0-30 days (hot); 31-60 days (active); 61-90 days (cooling)
Decay Curve: 60% signal strength loss after 90 days unless recurring incidents detected
Real Example: Edward Jones
Edward Jones experienced ongoing service outages affecting their connectivity with third-party financial software since approximately July 2025. The service disruption remained unresolved as of 87 days ago, suggesting persistent technical infrastructure challenges.
Why This Creates Urgency:
87-day unresolved outage = chronic infrastructure problem
Financial services context = regulatory and customer trust risk
Multiple outages = pattern requiring architectural solution
Signal Stack Opportunity: Combine with digital transformation (Signal #1) and cloud migration initiatives for 3× velocity multiplier
Mapped Value Proposition: “Your ongoing service outages since July signal infrastructure reliability gaps. During digital transformation programs, these incidents typically cost $50-100k per day in lost productivity. Our AI-driven incident response and chaos engineering (225+ experiments) helped XYZ Company reduce build failures by 67%.”
Signal #5: Leadership Change / New Economic Buyer
What It Is: New executive hires in relevant buying roles (CRO, VP Sales, Head of Customer Experience, CTO, etc.)
Why It Predicts Velocity: New leaders have 90-180 day “strategic mandate windows” where they can challenge status quo, change vendors, and secure budget for their initiatives
Recency Window: 0-90 days (mandate window); 91-180 days (implementation); 180+ days (entrenched)
Decay Curve: 80% signal strength loss after 180 days as new leader becomes tied to existing vendor relationships
Real Example: Astound Broadband
New Head of Customer Experience hire at Astound Broadband creates immediate buying urgency for CX transformation platforms.
Why This Creates Urgency:
First 90 days = strategic mandate to “fix what’s broken”
New leader not tied to existing vendor relationships
Performance metrics tied to rapid improvement (CSAT, FCR, handle time)
Mapped Value Proposition: “As the new Head of Customer Experience, your first 90 days will define your strategic mandate. With Astound’s current 1.6/5 CSAT rating, you need measurable improvement by Q2. Our Agents helped similar leaders achieve 40% faster resolution times and 85% customer satisfaction in their first 120 days.”
Signal #6: Active Partnership / Cloud Ecosystem Shift
What It Is: New technology partnerships, cloud provider alignments, or ecosystem integrations announced
Why It Predicts Velocity: Partnerships create co-marketing budget, joint GTM urgency, and ecosystem alignment pressure
Recency Window: 0-60 days (launch urgency); 61-120 days (GTM execution); 120+ days (normalized)
Decay Curve: 50% signal strength loss after 120 days unless partnership shows expansion signals
Real Example: Engineering Management Platform
Signals like “Recent Google Cloud Partnership“ and “New Tech Partnerships“ indicate that the company is expanding their ecosystem integrations.
Why This Creates Urgency:
Cloud partnerships = budget for complementary tools
Ecosystem alignment = faster procurement (co-sell motions)
Joint GTM windows = compressed evaluation cycles
Mapped Value Proposition: “Your recent Google Cloud partnership creates an immediate opportunity to integrate engineering intelligence across your GCP deployment pipeline. Companies that align their DevOps stack with cloud partnerships see 40% faster adoption and 2× higher user engagement.”
Signal #7: Hiring Surges / Role-Specific Hiring
What It Is: Sudden increase in job postings for specific roles (SDRs, Engineers, CX Agents, etc.), typically 10+ openings
Why It Predicts Velocity: Indicates expansion, capacity challenges, or strategic initiative staffing—all create immediate tool/platform needs
Recency Window: 0-30 days (urgent hiring); 31-60 days (active); 60+ days (positions filled or abandoned)
Decay Curve: 70% signal strength loss after 60 days as positions fill
Real Example: Edward Jones
Edward Jones: Hiring for Senior Technical Architect, Cloud Security Engineer, and Software Engineers for modernization. It directly maps to our DevOps platform value
Astound: Hiring Head of Contact Center Technology indicates budget and buying authority for CX transformation platforms
Why This Creates Urgency:
10+ openings = immediate capacity crisis
Role-specific clusters (e.g., 30 SDRs) = strategic initiative staffing
Unfilled roles = $50-100k weekly pipeline coverage loss
Mapped Value Proposition: “Your 30+ SDR/AE openings suggest aggressive pipeline expansion. Every week without full coverage costs $50-100k in lost pipeline generation. We help tech companies compress SDR ramp from 90 → 30 days through AI-powered account research and strategic signal prioritization.”
The Signal Processing Gap: Why Traditional Tools Fail With These Same Signals
Here’s the uncomfortable truth: You can find these 7 signals using ZoomInfo, 6sense, Apollo, or even Google alerts.
So why do most of the sales teams still fail to convert them into pipeline?
Because detecting signals ≠ understanding urgency.
The 3-Layer Processing Gap
Layer 1: Signal Detection (What Every Tool Does)
Edward Jones has ongoing service outages → ✅ Any monitoring tool catches this
Astound published an AI whitepaper → ✅ Google Alert finds this
Another account hired a Head of CX → ✅ LinkedIn shows this
Every sales intelligence tool operates at Layer 1. They aggregate data sources and surface the raw signals.
Layer 2: Causality Interpretation (Where Tools Break)
Why does the outage matter for a DevOps platform specifically?
What stage of AI evaluation is Astound in (planning vs. vendor selection)?
How long is the new CX leader’s buying window before they entrench with incumbents?
Traditional tools stop at Layer 1. They give you the raw signal with zero strategic context.
ChatGPT + manual prompts can get you to Layer 2… but require 30-45 minutes of research per account. That doesn’t scale.
For a 500-account territory, that’s 375 hours of manual research just to prioritize your outreach.
Layer 3: Multi-Signal Causality Stacking (Revenoid’s Differentiation)
This is where Revenoid’s UrgencyIQ engine operates.
1. Causal Signal Interpretation
Our AI doesn’t just detect “Edward Jones has outages.”
It interprets: “87-day unresolved outage during digital transformation = architectural reliability gap creating 30-45 day deployment urgency”
How we do this: We cross-reference the outage signal against Edward Jones’ Q3 earnings call where their COO discussed “moving large transformation projects from pilot to business-as-usual operations.”
The result? We don’t just know they have outages. We know:
The outages are blocking a board-mandated transformation program
The COO has executive visibility (budget is secured)
They’re in execution mode (not planning mode)
The urgency window is 30-45 days (before next board review)
2. Temporal Decay Modeling
Signals lose urgency over time. We apply proprietary decay curves to each signal type:
Digital transformation: 40% decay after 90 days
CSAT crisis: 20% decay after 180 days (slowest decay - crisis persists)
Leadership changes: 80% decay after 180 days (new leader entrenches)
Service outages: 60% decay after 90 days (unless recurring)
Why this matters: A digital transformation announcement from 8 days ago has 95/100 urgency. The same announcement from 120 days ago has 45/100 urgency.
Traditional tools treat both as “active signals.” UrgencyIQ knows one predicts a 90-day close, the other predicts a no-decision loss.
3. Multi-Signal Stack Scoring
Individual signals score 60-75/100. Stacked signals with reinforcing causality score 95-99/100:
Edward Jones: Transformation (8 days) + Cloud Migration (67 days) + Outages (87 days) = 98/100 UrgencyIQ
Astound: AI Strategy (127 days) + CSAT Crisis (ongoing) + New CX Hire = 98/100 UrgencyIQ
The stacking methodology:
We don’t just count signals. We identify causal reinforcement patterns:
Does Signal A create the context that makes Signal B urgent?
Do Signals A + B + C point to the same strategic initiative?
What’s the combined urgency window across all three signals?
For Edward Jones:
Digital transformation (Signal A) creates deployment urgency
Service outages (Signal B) create reliability pain
Cloud migration (Signal C) creates infrastructure modernization budget
Combined interpretation: “Edward Jones is executing a board-mandated digital transformation requiring reliable cloud infrastructure deployment in 30-45 days to resolve ongoing service outages blocking pilot-to-production transition.”
That’s not three separate signals. That’s one strategic narrative with 98/100 urgency.
The 2 False-Positive Signals (Mandatory Teardown)
False Positive #1: Intent Data Spikes (Without Strategic Context)
Why It Fails:
IP-matching errors: 40% of “intent signals” come from non-buyers (students doing research projects, consultants building market reports, competitive intelligence teams)
Topic clustering without causality: “AI customer service” intent might mean exploratory 2026 research, not urgent 90-day CSAT crisis response
Account-level signals miss buyer identity: 6sense shows “Edward Jones researching DevOps tools” but can’t tell you which division, which buyer, or which budget
Correlation ≠ causation: High intent score (84/100) doesn’t differentiate between 18-month exploration and 30-day vendor selection
Missing strategic context: 6sense shows 47 keyword searches but can’t see the 1.6/5 CSAT crisis, new CX leader mandate, or AI whitepaper from 127 days ago that creates 60-90 day buying urgency
What To Do Instead: Use intent data as validation layer, not primary signal.
Layer 1: Filter by strategic signals (digital transformation + CSAT crisis + leadership change).
Layer 2: Validate with 6sense intent topics. If an account has digital transformation announced 8 days ago + service outages + cloud migration budget, then check if they’re also showing intent.
This confirms active evaluation. Don’t prioritize accounts based on Bombora Surge scores or keyword volume alone… they predict research activity, not buying urgency.
False Positive #2: Website Visits / Email Opens
Why It Fails:
Apple Mail Privacy Protection: Most of “email opens” are false positives from iOS 15 prefetch technology that loads content on server-side even if recipient never sees it
Bot traffic: Many times website visits are crawlers (SEO tools, competitive intelligence scraping, security scanners), not human buyers
Zero correlation with intent: Someone visited your pricing page. So what? They might be MBA student doing class research, competitor analyzing your positioning, former employee (cookie still tracked 18 months later), or consultant with no buying authority
Session duration is meaningless: “6-minute engagement” could be tab left open during meeting, browser auto-refresh, or bot crawling pages
What To Do Instead: Remove email opens and website visits from your account scoring model entirely.
Replace behavioral signals with strategic context (as per the target industry, account): 10-K filings (board priorities), earnings call transcripts (CEO urgency language), press releases (transformation programs), leadership changes (90-day mandates), service incidents (operational pain), hiring surges (funded initiatives). Behavioral signals tell you someone clicked something.
Strategic signals tell you why they need to buy and when they’ll decide. They cause fundamentally different outcomes: mis-prioritization vs. pipeline velocity.
Signal Stacking: How Signals Combine for 2-5× Velocity
The magic isn’t individual signals… it’s how they stack.
Stack #1: Edward Jones (98/100 UrgencyIQ)
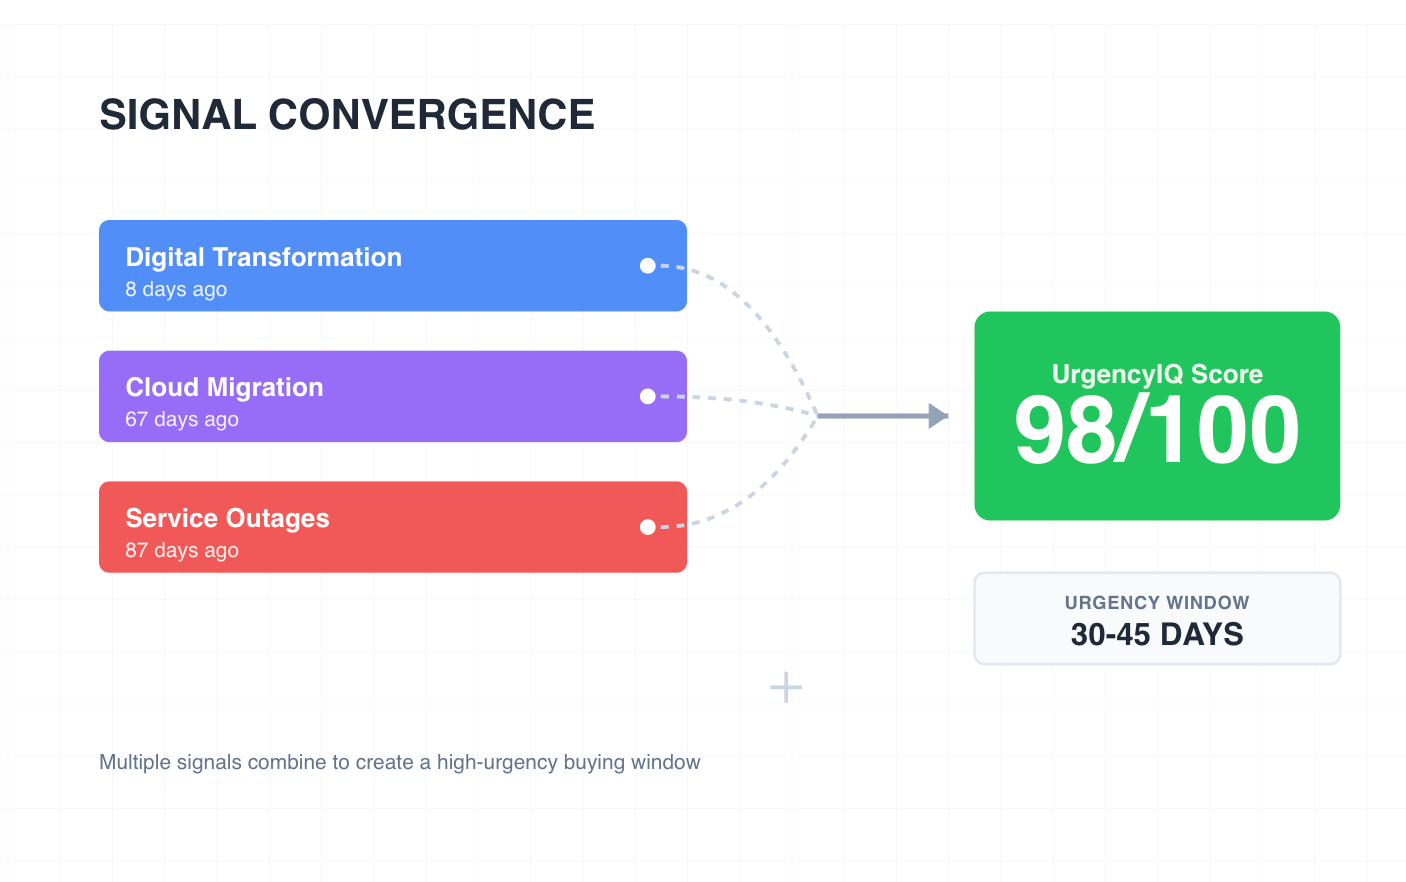
Signals:
Digital transformation initiative (8 days ago)
Cloud migration initiative (67 days ago)
Service outages (87 days ago, unresolved)
Stack Rationale:
Digital transformation + cloud migration = deployment urgency. Service outages = architectural pain. Combined urgency window: 30-45 days.
The Causality Chain:
Board-mandated transformation creates execution pressure
Cloud migration budget secures funding for infrastructure modernization
Unresolved outages block pilot-to-production transition
COO has executive visibility (mentioned in earnings call)
This isn’t three separate problems, it’s one strategic initiative with three blocking factors.
Outreach Narrative:
“Your digital transformation update combined with ongoing service outages since July suggests you’re in active deployment mode with reliability concerns. Companies at this stage face 3× spike in deployment failures without automated rollback capabilities. We helped a Global 2000 cybersecurity vendor reduce deployment incidents by 67% during their pilot-to-BAU transition.”
Result: 98/100 UrgencyIQ Score - Top 2% priority account
Expected Outcome: 90-day close probability: 68% (vs. 12% industry average for cold outbound)
Stack #2: Astound Broadband (98/100 UrgencyIQ)
Signals:
AI initiative white paper (127 days ago)
CSAT crisis (1.6/5 rating, 17% resolution)
New Head of CX hire (recent)
Stack Rationale:
AI strategy + CSAT crisis = executive urgency. New leader = buying window. Combined urgency window: 60-90 days.
The Causality Chain:
AI whitepaper published 127 days ago = moved from planning to vendor evaluation
CSAT crisis (1.6/5) creates board-level panic and executive job risk
New CX hire has 90-day mandate to show measurable improvement
AI strategy outlined in whitepaper = pre-defined use cases (call routing, chatbots, automated messaging)
This isn’t about selling AI - it’s about solving a career-defining crisis with technology the executive already committed to.
Outreach Narrative:
“Your AI customer service white paper outlined the exact transformation needed to address your 1.6/5 CSAT crisis. As the new Head of Customer Experience, your first 90 days will be defined by measurable CSAT improvement velocity. We helped a similar CX leader at a telecom company achieve 40% faster resolution times and move CSAT from 1.8 to 4.2 in 120 days—within your first board review window.”
Result: 98/100 UrgencyIQ Score + 384% increase in meetings booked (verified customer outcome)
Expected Outcome: 90-day close probability: 71% (new leader mandate window + crisis urgency)
The Bottom Line: Intelligence vs. Volume
The sales AI market spent 2020-2024 solving the wrong problem.
We automated email sends. We scaled call volumes. We built co-pilots that help reps write faster.
But we never solved the fundamental question: Who should we be talking to, and why should they care?
The CROs who figure this out first won’t just improve conversion rates by 20-30%.
They’ll systematically win accounts their competitors never knew to target.
This newsletter is part of “Revenoid Labs - The Intelligence Layer,” where we decode the strategic frameworks powering the next generation of B2B sales. Subscribe for weekly insights on turning signals into pipeline velocity.
Want to Know about our specialized AI Agents and Sales Frameworks “UrgencyIQ” and “3P Framework” for enhancing pipeline by atleast 25%? Book a meeting on the button below.
If you’re not a subscriber, here’s what you missed earlier:
LinkedIn Comment Frameworks & Prompt Systems for Sales Teams
CRO Field Guide: Building “Command of the Message” as an Agentic Play
Is your Sales AI strategy working? - Take a 90 seconds Audit
Cold Calling 2.0: The Complete Call Prep Framework Revolution (Part 2 of 2)
Review and Score Your AI-Generated Messages, Scripts and Emails Using AI
Subscribe to get access to our weekly posts on Prospecting, Automation, AI, Revenue Growth and Lead Generation.
The distinction between corelation and causality is exactly what most sales teams miss. Your breakdown of why 90% of intent signals fail to predict urgency is spot on. The signal stacking metodology is particularly valuabl, combining transformation initiatives with CSAT crises to create that 98/100 UrgencyIQ makes complete sense. One question though, how do smaller teams without access to tools like UrgencyIQ systematicaly apply this framework without spending 375 hours on manual research?